Uma cobertura em treliça possui essa configuração ...
Criado em: 12 de maio de 2025
Criado em: 12 de maio de 2025
Uma cobertura em treliça possui essa configuração mostrada abaixo. Determine seu grau de estaticidade:
pythonfrom PIL import Image
import matplotlib.pyplot as plt

img = Image.open('/mnt/data/07b2bb8475165a85688f675888a96101.jpeg')
plt.imshow(img); plt.axis('off')

(-0.5, 3031.5, 895.5, -0.5)
pythonplt.figure(figsize=(4,2))
plt.imshow(img.crop((900,0,1589,498))); plt.axis('off')

(-0.5, 688.5, 497.5, -0.5)
pythonplt.figure(figsize=(6,2))
plt.imshow(img.crop((700,0,1589,498))); plt.axis('off')

(-0.5, 888.5, 497.5, -0.5)
pythonplt.figure(figsize=(6,2))
plt.imshow(img.crop((0,200,1589,498))); plt.axis('off')

(-0.5, 1588.5, 297.5, -0.5)
pythonplt.figure(figsize=(6,2))
plt.imshow(img.crop((0,0,800,498))); plt.axis('off')

(-0.5, 799.5, 497.5, -0.5)
pythonplt.figure(figsize=(6,4))
plt.imshow(img.crop((0,200,800,700))); plt.axis('off')

(-0.5, 799.5, 499.5, -0.5)
pythonplt.figure(figsize=(6,4))
plt.imshow(img.crop((0,200,800,700))); plt.axis('off')

(-0.5, 799.5, 499.5, -0.5)
(-0.5, 799.5, 499.5, -0.5)
text
pythonplt.figure(figsize=(6,4))
plt.imshow(img.crop((0,550,800,1100))); plt.axis('off')

(-0.5, 799.5, 549.5, -0.5)
pythonplt.figure(figsize=(6,4))
plt.imshow(img.crop((600,550,1400,1100))); plt.axis('off')

(-0.5, 799.5, 549.5, -0.5)
pythonprint(img.size)
pythonplt.figure(figsize=(6,4))
plt.imshow(img.crop((0,400,900,896))); plt.axis('off')

(-0.5, 899.5, 495.5, -0.5)
pythonplt.figure(figsize=(6,4))
plt.imshow(img.crop((600,0,1350,600))); plt.axis('off')

(-0.5, 749.5, 599.5, -0.5)
pythonplt.figure(figsize=(6,4))
plt.imshow(img.crop((900,200,1500,800))); plt.axis('off')

(-0.5, 599.5, 599.5, -0.5)
pythonplt.figure(figsize=(6,4))
plt.imshow(img.crop((1400,400,2300,896))); plt.axis('off')

(-0.5, 899.5, 495.5, -0.5)
pythonplt.figure(figsize=(6,4))
plt.imshow(img.crop((2300,400,3032,896))); plt.axis('off')

(-0.5, 731.5, 495.5, -0.5)
pythonplt.figure(figsize=(6,4))
plt.imshow(img.crop((1800,300,2300,896))); plt.axis('off')

(-0.5, 499.5, 595.5, -0.5)
pythonplt.figure(figsize=(6,4))
plt.imshow(img.crop((0,300,500,896))); plt.axis('off')

(-0.5, 499.5, 595.5, -0.5)
pythonplt.figure(figsize=(6,4))
plt.imshow(img.crop((300,200,800,600))); plt.axis('off')

(-0.5, 499.5, 399.5, -0.5)
pythonplt.figure(figsize=(6,4))
plt.imshow(img.crop((300,350,800,896))); plt.axis('off')

(-0.5, 499.5, 545.5, -0.5)
pythonplt.figure(figsize=(6,4))
plt.imshow(img.crop((800,0,1200,600))); plt.axis('off')

(-0.5, 399.5, 599.5, -0.5)
pythonplt.figure(figsize=(10,3))
plt.imshow(img); plt.axis('off')

(-0.5, 3031.5, 895.5, -0.5)
pythonplt.figure(figsize=(6,4))
plt.imshow(img.crop((0,300,600,800))); plt.axis('off')

(-0.5, 599.5, 499.5, -0.5)
pythonplt.figure(figsize=(10,4))
plt.imshow(img.crop((0,200,1500,900))); plt.axis('off')

(-0.5, 1499.5, 699.5, -0.5)
pythonplt.figure(figsize=(10,4))
plt.imshow(img.crop((0,200,1500,900))); plt.axis('off')

(-0.5, 1499.5, 699.5, -0.5)
(-0.5, 1499.5, 699.5, -0.5)
text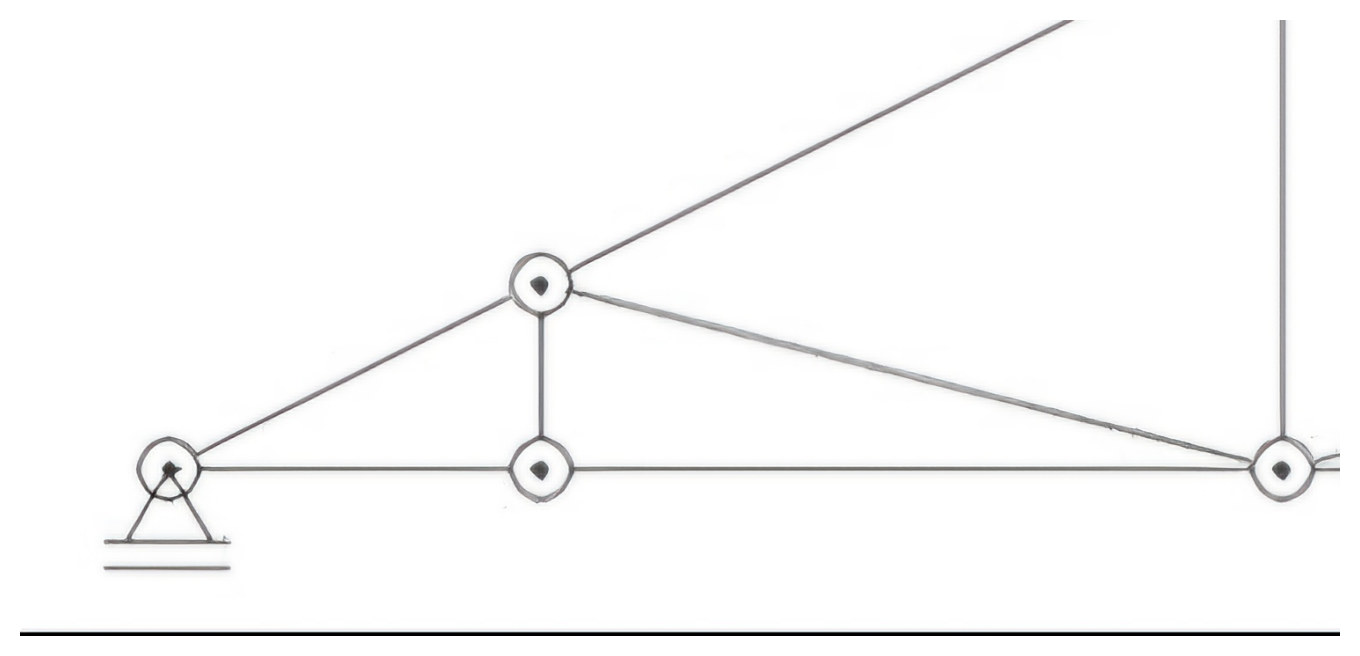
pythonplt.figure(figsize=(10,4))
plt.imshow(img.crop((800,0,1600,900))); plt.axis('off')

(-0.5, 799.5, 899.5, -0.5)
pythonplt.figure(figsize=(6,4))
plt.imshow(img.crop((1200,200,1800,800))); plt.axis('off')

(-0.5, 599.5, 599.5, -0.5)
pythonplt.figure(figsize=(6,4))
plt.imshow(img.crop((1800,200,2700,800))); plt.axis('off')

(-0.5, 899.5, 599.5, -0.5)
pythonplt.figure(figsize=(6,4))
plt.imshow(img.crop((2200,200,3032,800))); plt.axis('off')

(-0.5, 831.5, 599.5, -0.5)
pythonplt.figure(figsize=(6,4))
plt.imshow(img.crop((2000,500,3032,896))); plt.axis('off')

(-0.5, 1031.5, 395.5, -0.5)
pythonplt.figure(figsize=(6,4))
plt.imshow(img.crop((0,400,800,800))); plt.axis('off')

(-0.5, 799.5, 399.5, -0.5)
pythonplt.figure(figsize=(6,4))
plt.imshow(img.crop((0,400,800,800))); plt.axis('off')

(-0.5, 799.5, 399.5, -0.5)
(-0.5, 799.5, 399.5, -0.5)
text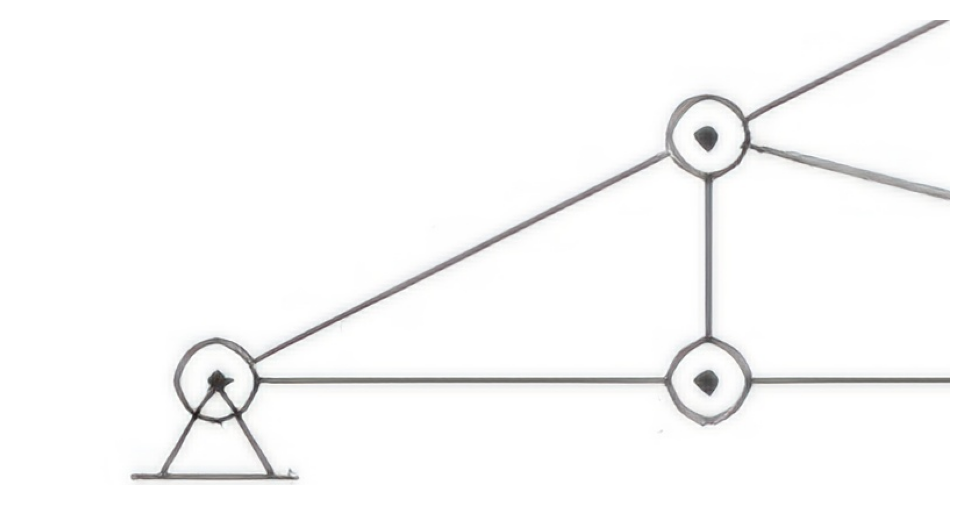
pythonplt.figure(figsize=(4,4))
plt.imshow(img.crop((200,500,500,800))); plt.axis('off')

(-0.5, 299.5, 299.5, -0.5)
pythonplt.figure(figsize=(4,4))
plt.imshow(img.crop((200,400,800,550))); plt.axis('off')

(-0.5, 599.5, 149.5, -0.5)
pythonplt.figure(figsize=(10,3))
plt.imshow(img); plt.show()
pythonplt.figure(figsize=(6,4))
plt.imshow(img.crop((0,200,900,550))); plt.axis('off')

(-0.5, 899.5, 349.5, -0.5)
pythonplt.figure(figsize=(6,4))
plt.imshow(img.crop((0,350,700,800))); plt.axis('off')

(-0.5, 699.5, 449.5, -0.5)
pythonplt.figure(figsize=(6,4))
plt.imshow(img.crop((2200,650,3032,850))); plt.axis('off')

(-0.5, 831.5, 199.5, -0.5)
pythonplt.figure(figsize=(4,4))
plt.imshow(img.crop((2300,650,2600,850))); plt.axis('off')

(-0.5, 299.5, 199.5, -0.5)
pythonplt.figure(figsize=(4,4))
plt.imshow(img.crop((2300,650,2600,850))); plt.axis('off')

(-0.5, 299.5, 199.5, -0.5)
(-0.5, 299.5, 199.5, -0.5)
text
pythonplt.figure(figsize=(4,4))
plt.imshow(img.crop((2300,650,2600,850))); plt.axis('off')

(-0.5, 299.5, 199.5, -0.5)
(-0.5, 299.5, 199.5, -0.5)
text (-0.5, 299.5, 199.5, -0.5)
pythonplt.figure(figsize=(4,4))
plt.imshow(img.crop((2500,650,3032,850))); plt.axis('off')

(-0.5, 531.5, 199.5, -0.5)
pythonplt.figure(figsize=(4,4))
plt.imshow(img.crop((2500,650,3032,850))); plt.axis('off')

(-0.5, 531.5, 199.5, -0.5)
(-0.5, 531.5, 199.5, -0.5)
text
Passo‑a‑passo do balanço de incógnitas
| Quantidade | Símbolo | Como foi obtido | Valor |
|---|---|---|---|
| Nós (j) | 5 nós na corda inferior (apoios A e J + 3 nós intermediários) + 3 nós na corda superior (2 intermediários + o ápice) | 8 | |
| Barras (m) | 4 da corda inferior (A‑B, B‑F, F‑H, H‑J)<br>3 montantes verticais (B‑C, F‑D, H‑G)<br>2 da corda superior (C‑D, D‑G)<br>4 diagonais (A‑C, C‑F, F‑G, G‑J) | 13 | |
| Reacções de apoio (r) | Pino em A: 2 · Roda em J: 1 | 3 |
Para treliças planas usa‑se
Observação extra: o critério interno também é satisfeito (13 = 2·8 – 3), confirmando que a geometria está devidamente triangulada e não há mecanismos.